Intro Statistics — Descriptive Statistics and Probability flashcards
10 of 80 cards free to study here · 6 topics · the whole deck is built into Willys
The first half of a college intro statistics course: data types and sampling, graphs, center and spread, z-scores, probability rules and conditional probability, binomial, Poisson and other discrete models, uniform and exponential models, and the normal distribution.
Learn deck · part of Introductory Statistics · written against: Standard one-semester intro statistics course; OpenStax Introductory Statistics 2e, consulted as a reference; no text copied. Updated 2026-10-10.
Study the free sample
10 cards from the deck as they are. Flip, rate yourself, filter by topic; your progress stays in this browser.
Tap the card or press Space to flip
The 10 sample cards as a list
-
A survey records how many siblings each student has. Is that variable discrete or continuous?Discrete quantitative. Counts can only take separate values (0, 1, 2, …), with nothing in between.Sampling and Data
Watch out: quantitative does not mean continuous — continuous variables are measurements such as height or time. -
What are the four levels of measurement, from least to most informative?Nominal (categories only), ordinal (categories with an order), interval (equal differences but no true zero) and ratio (a true zero, so ratios make sense).Sampling and Data
Example: blood type, class rank, temperature in °C, weight in kg. -
A bar chart comparing two companies' satisfaction scores starts its vertical axis at 95 instead of 0. Why can that mislead?Descriptive Statistics › Graphs
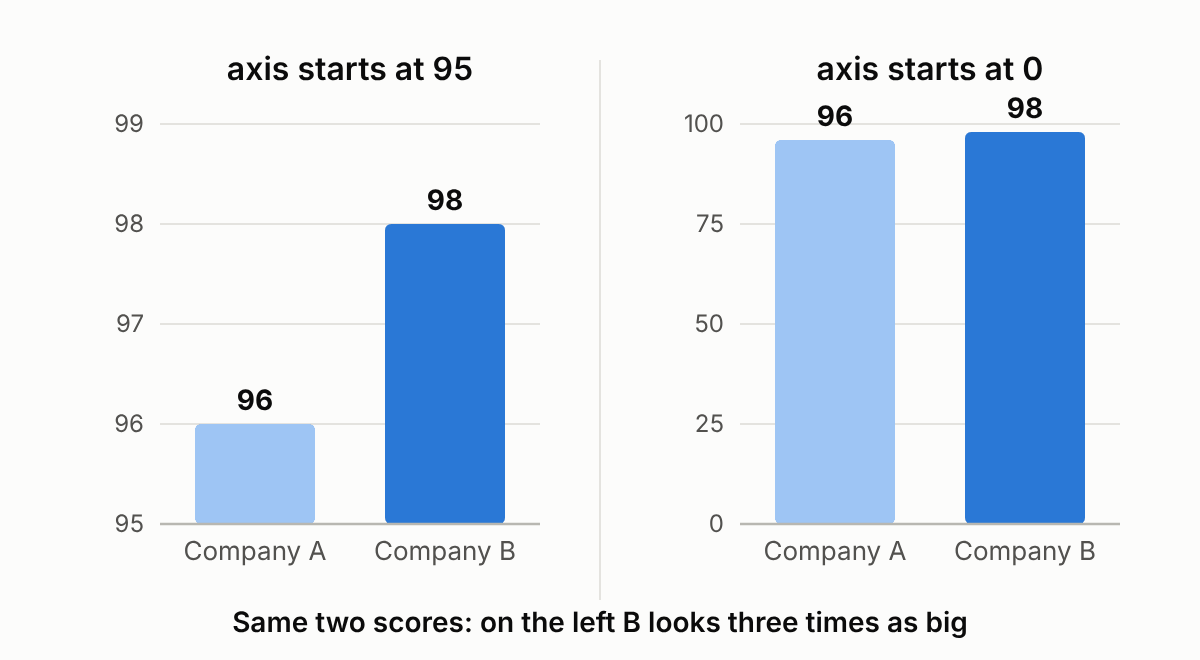 A truncated axis stretches small differences: a gap of 96 vs. 98 can look like one bar is several times taller. Check the axis scale before judging the size of a difference.
-
Using the median-of-halves method, what are the quartiles and IQR of 1, 3, 4, 6, 7, 8, 10, 12?Descriptive Statistics › Center and Spread
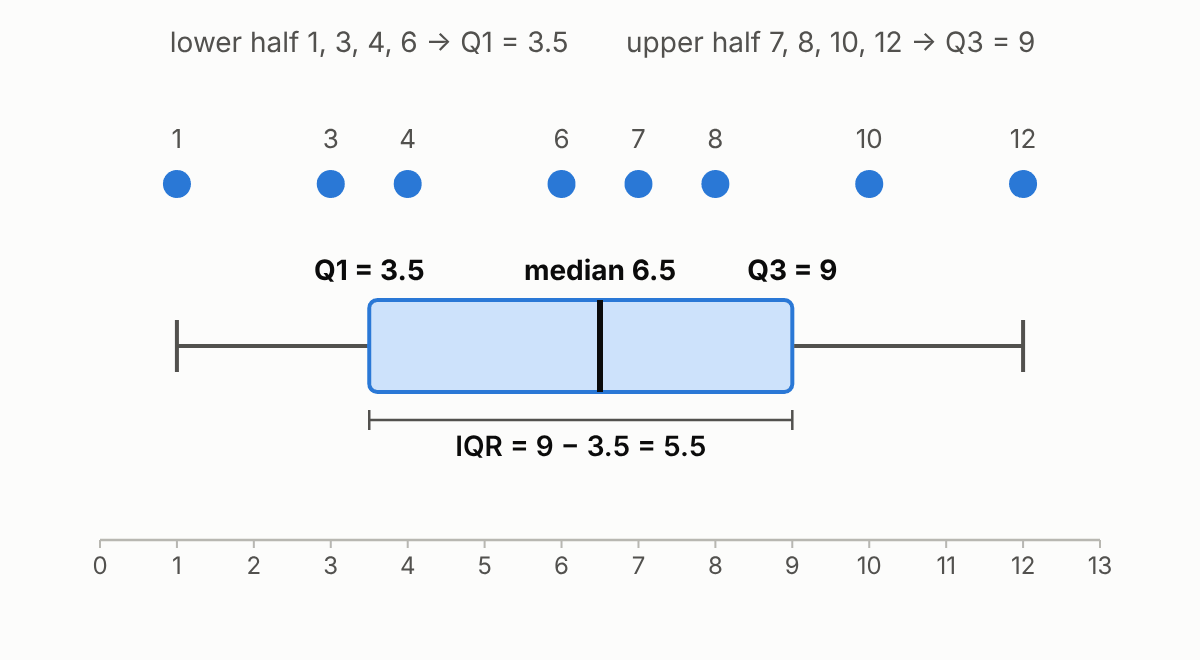 Lower half 1, 3, 4, 6 gives Q1 = 3.5; upper half 7, 8, 10, 12 gives Q3 = 9; so IQR = 5.5.
Watch out: software packages use slightly different quartile rules, so small differences from a textbook answer are normal. -
One card is drawn from a standard deck. What is P(heart or king)?Probability Topics
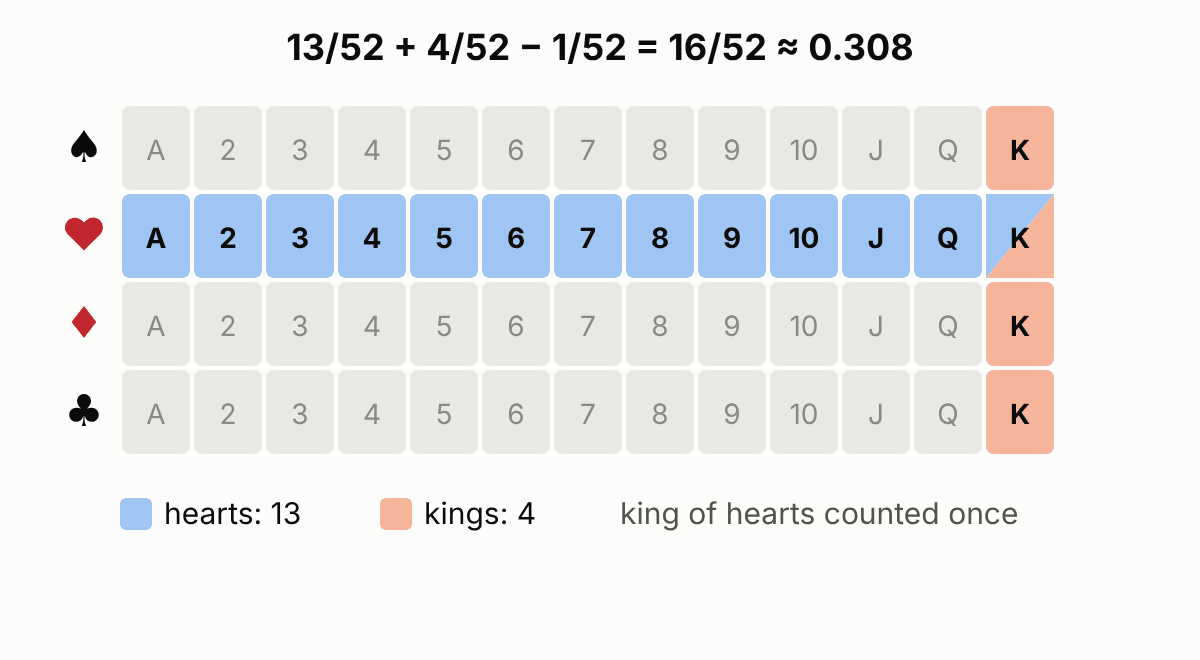 The events overlap (the king of hearts), so use the general addition rule: .
-
At a college, 60% of students take statistics, 50% take economics and 30% take both. What share take neither?Probability Topics
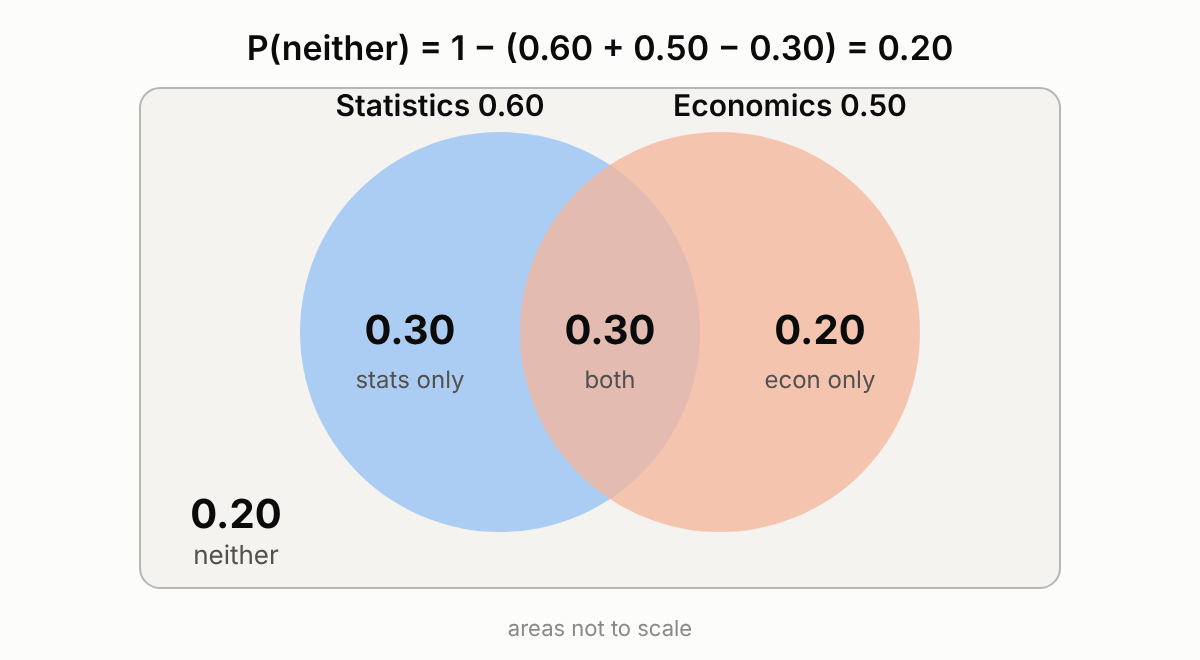 P(stats or econ) = 0.60 + 0.50 − 0.30 = 0.80, so P(neither) = 1 − 0.80 = 0.20. A Venn diagram makes the overlap easy to see.
-
X takes the values 0, 1 and 2 with probabilities 0.2, 0.5 and 0.3. What are its mean and standard deviation?. Then , so .Discrete Random Variables › Expected Value
-
How does the shape of a binomial distribution depend on p and n?Discrete Random Variables › Binomial
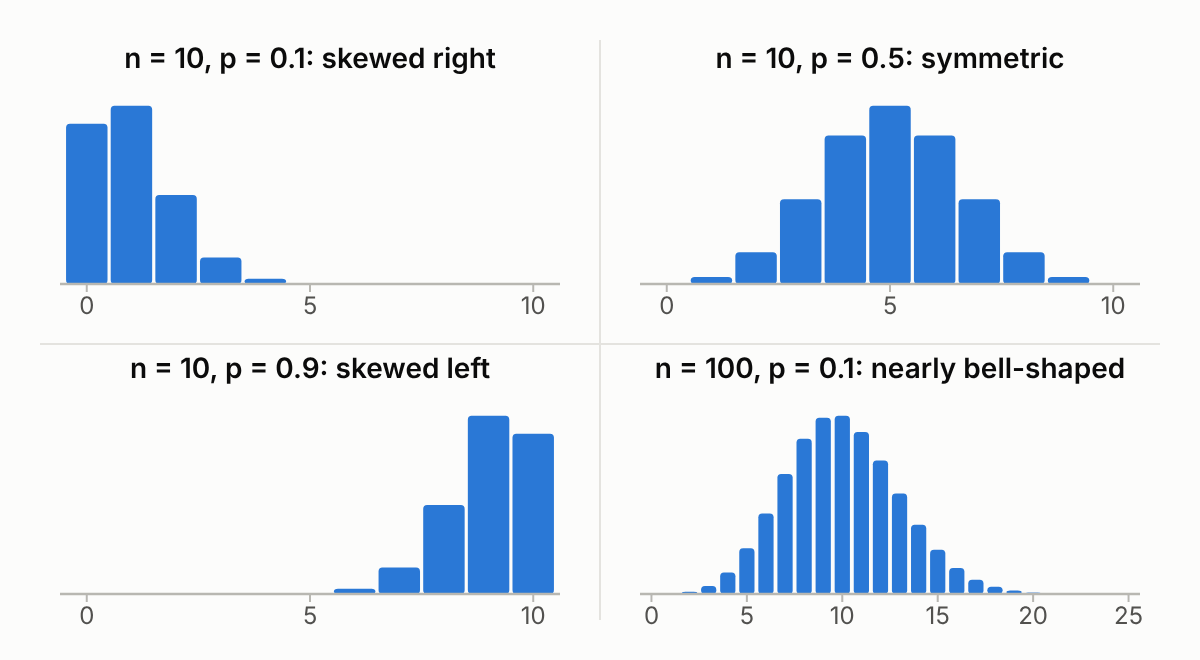 It is symmetric when p = 0.5, right-skewed when p is small and left-skewed when p is large. As n grows, the skew fades and the distribution becomes more bell-shaped.
-
A shuttle arrives at a uniformly random time within a 20-minute window. What is the probability you wait more than 15 minutes?Continuous Random Variables
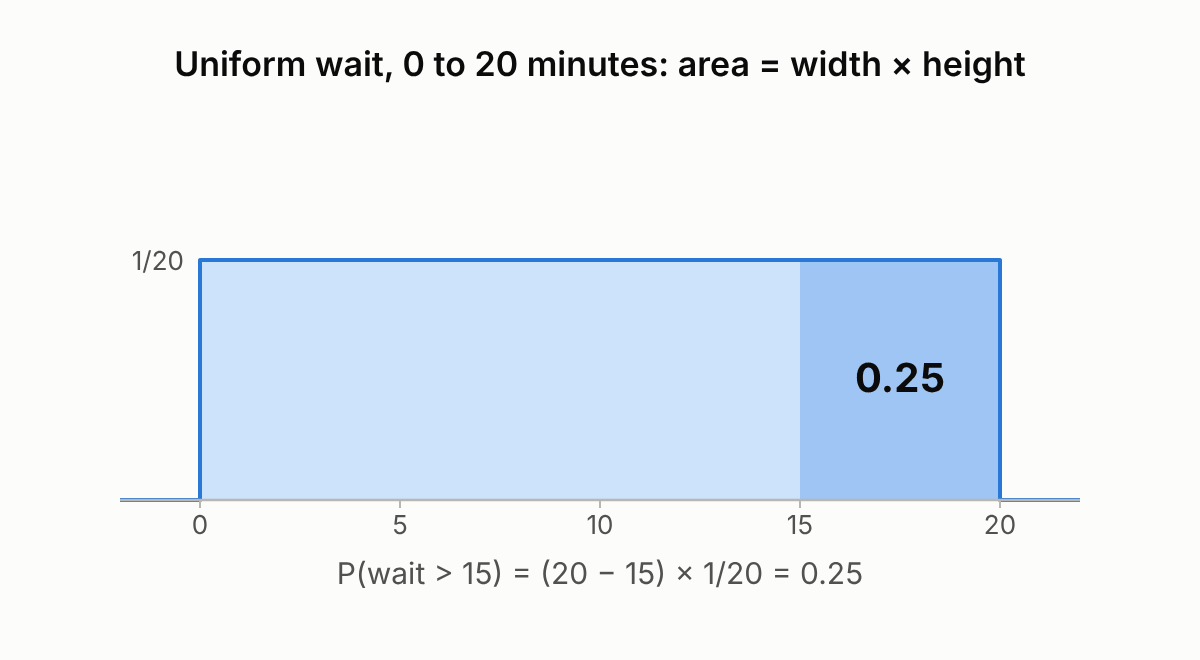 For a uniform distribution, probability is proportional to length: .
-
A test is normal with mean 500 and SD 100. By the empirical rule, roughly what share of test-takers score between 400 and 700?The Normal Distribution
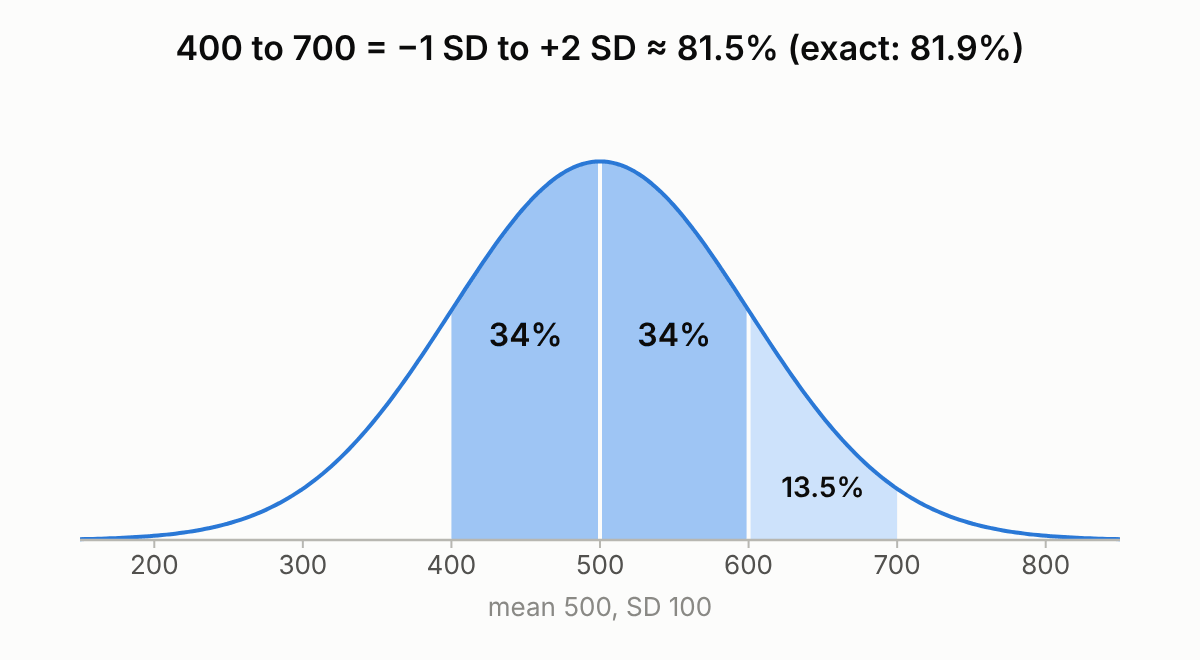 From −1 to +2 SDs: 34% + 34% + 13.5% = 81.5%. Exact normal tables give about 81.9%.
Unlock the whole deck
You are studying a free 10-card sample. All 80 cards of Intro Statistics — Descriptive Statistics and Probability, the other 2 Introductory Statistics decks, and spaced-repetition scheduling are built into Willys. 14-day free trial, then $14.99 a year.
In Willys, tap Exam Library at the top of your Decks (or Browse Exam Library… under the + button), find the exam on its shelf or by search, tick it and tap Add.
More Introductory Statistics decks
← All Introductory Statistics decks, with the study guide and topic outline.
About these cards
Review status: Second-reader reviewed, with corrections applied.
Checked against:
- OpenStax Introductory Statistics 2e, consulted as a reference; no text copied.
- Diagrams are original, drawn for this deck by tools/diagrams/intro_statistics.py from the numbers on each card (SVG source and PNG in media/).
These are independent study notes written for Willys. They are not official exam material, may contain mistakes, and are no substitute for your course, your teacher or the exam owner's own publications. Found an error? Tell us — corrections ship as a new version of the deck.
Use of these pages is covered by our Terms of Use.