Intro Statistics — Inference and Regression flashcards
10 of 74 cards free to study here · 7 topics · the whole deck is built into Willys
The second half of a college intro statistics course: the central limit theorem, confidence intervals, one- and two-sample z and t tests, p-values and errors, chi-square tests, correlation and least-squares regression, and one-way ANOVA with the F distribution.
Learn deck · part of Introductory Statistics · written against: Standard one-semester intro statistics course; OpenStax Introductory Statistics 2e, consulted as a reference; no text copied. Updated 2026-10-10.
Study the free sample
10 cards from the deck as they are. Flip, rate yourself, filter by topic; your progress stays in this browser.
Tap the card or press Space to flip
The 10 sample cards as a list
-
What is the most common misreading of the central limit theorem?The Central Limit Theorem
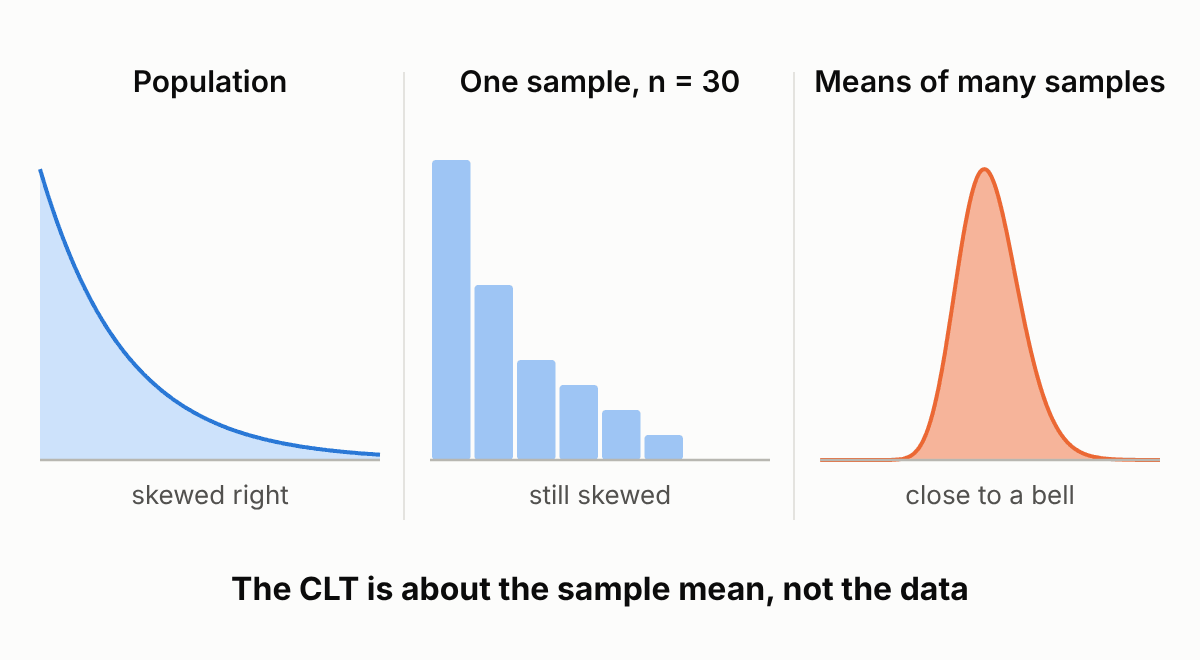 Thinking it makes the data normal. The CLT is about the sampling distribution of the sample mean: a big sample from a skewed population still looks skewed, but the means of many such samples pile up in a bell shape.
-
Exam scores have a mean of 70 and an SD of 12. For random samples of 36 students, what are the mean and standard error of ?The sampling distribution is centered at 70, with standard error points.The Central Limit Theorem
-
A 95% confidence interval for mean commute time is 22 to 28 minutes. Does that mean 95% of commuters take 22 to 28 minutes?No. The interval estimates the population mean, not individual commutes. Individual times are far more spread out than the uncertainty about their average.Confidence Intervals
-
A news report gives a 95% confidence interval of 0.38 to 0.46 for a proportion. What are the point estimate and the margin of error?The point estimate is the midpoint, 0.42, and the margin of error is half the width, 0.04.Confidence Intervals
-
A researcher says, "p = 0.04, so there is a 4% chance the null hypothesis is true." What is wrong?A p-value is computed assuming H₀ is true: it is the probability of data at least as extreme as those observed. It is not the probability that H₀ is true, which classical tests never calculate.Hypothesis Testing with One Sample › Logic and Errors
-
A test statistic is z = 1.80. Do you reject H₀ at α = 0.05 in a right-tailed test? In a two-tailed test?Hypothesis Testing with One Sample › Logic and Errors
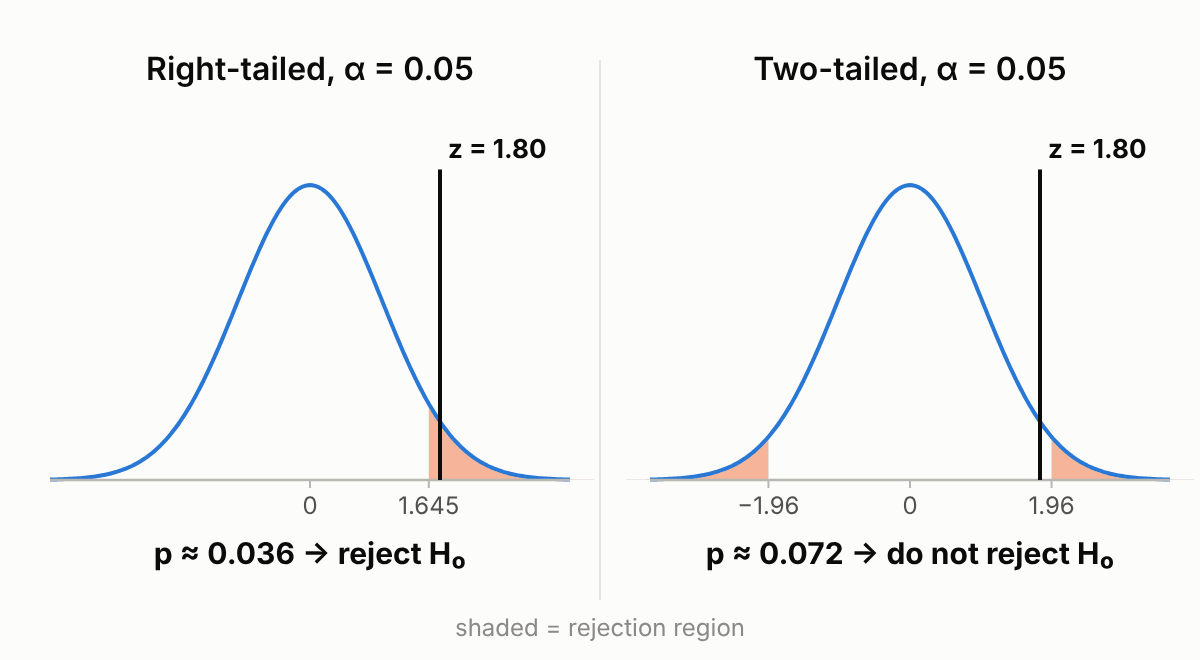 Right-tailed: reject, since 1.80 > 1.645 (p ≈ 0.036). Two-tailed: do not reject, since 1.80 < 1.96 (p ≈ 0.072).
-
Five students' score changes (after − before) are 3, 5, −1, 4 and 4. Test whether the mean change is positive.Work with the differences: and , so with 4 df, giving p ≈ 0.023 one-sided.Hypothesis Testing with Two Samples
-
Why is a chi-square test of goodness of fit or independence right-tailed?The Chi-Square Distribution
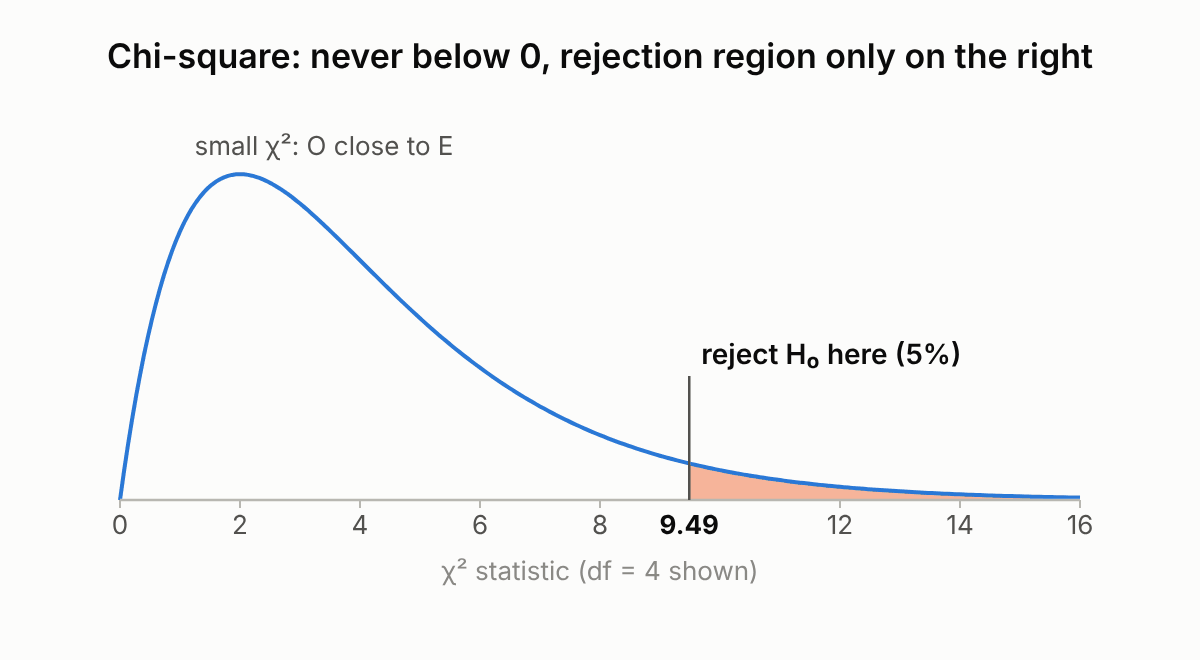 The statistic squares every gap, so it can never be negative, and only large values signal disagreement with H₀.
-
The correlation between hours of TV watched and GPA among students is r = −0.85. How do you describe it?Linear Regression and Correlation
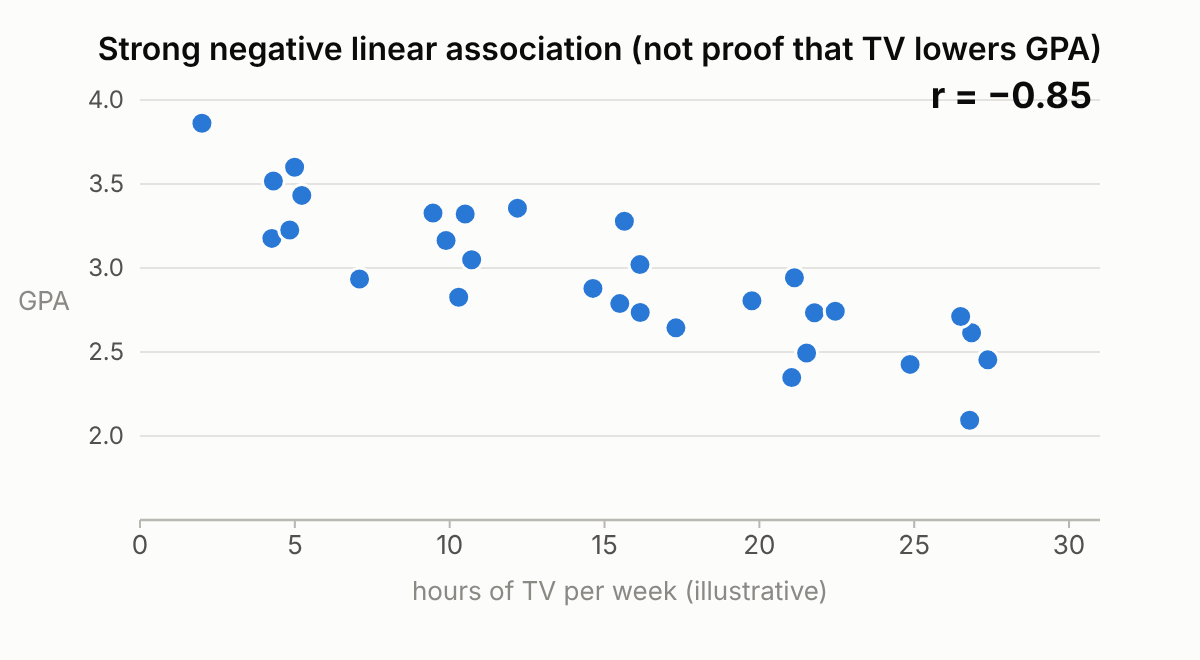 A strong negative linear association: students who watch more TV tend to have lower GPAs. It does not show that TV lowers GPA.
-
What does an F distribution look like?F Distribution and One-Way ANOVA
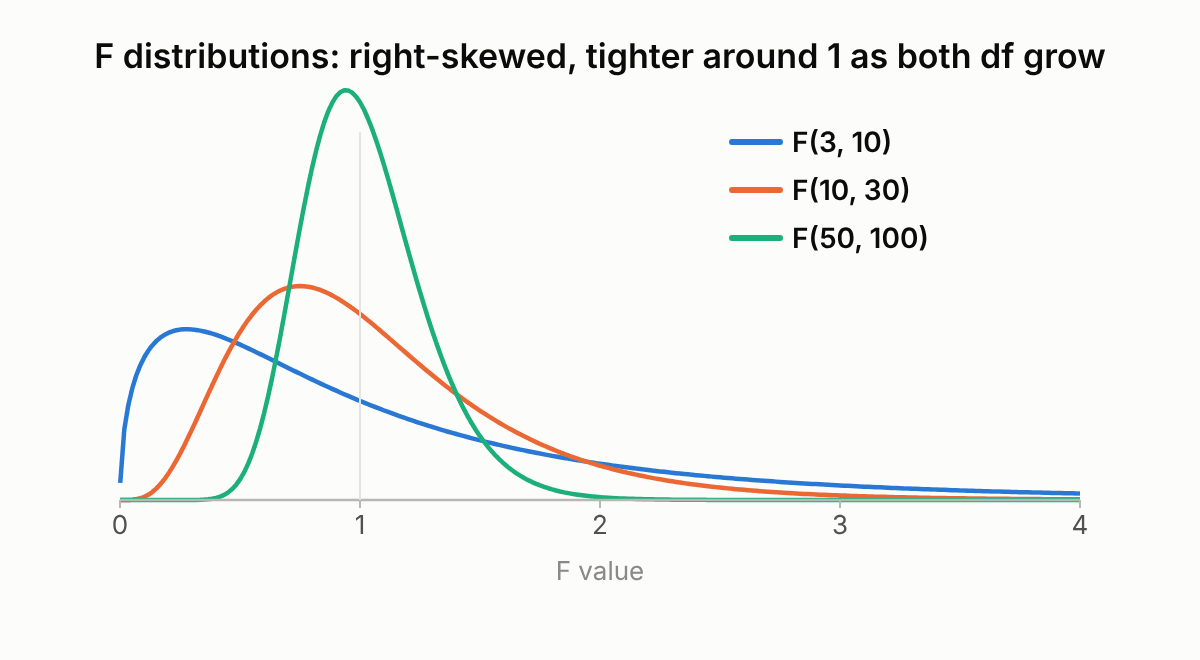 It takes only nonnegative values, is skewed right, and is defined by two degrees of freedom (numerator and denominator). As both grow, it concentrates more tightly around 1.
Unlock the whole deck
You are studying a free 10-card sample. All 74 cards of Intro Statistics — Inference and Regression, the other 2 Introductory Statistics decks, and spaced-repetition scheduling are built into Willys. 14-day free trial, then $14.99 a year.
In Willys, tap Exam Library at the top of your Decks (or Browse Exam Library… under the + button), find the exam on its shelf or by search, tick it and tap Add.
More Introductory Statistics decks
← All Introductory Statistics decks, with the study guide and topic outline.
About these cards
Review status: Second-reader reviewed, with corrections applied.
Checked against:
- OpenStax Introductory Statistics 2e, consulted as a reference; no text copied.
- Diagrams are original, drawn for this deck by tools/diagrams/intro_statistics.py from the numbers on each card (SVG source and PNG in media/).
These are independent study notes written for Willys. They are not official exam material, may contain mistakes, and are no substitute for your course, your teacher or the exam owner's own publications. Found an error? Tell us — corrections ship as a new version of the deck.
Use of these pages is covered by our Terms of Use.